Monitoring HAProxy (http://haproxy.org) is somewhat hard to do. Yes, we have nice web/stats interface, but watching the web interface can be fun for an hour or two, but after that… You have to find a better solution. Company where I work uses PRTG Network Monitor (http://www.paessler.com/prtg) that provides EXE/XML Custom sensors which allow you to run custom sensor scripts.
You can find the script here https://gist.github.com/jlazic/50af0c706196bf81b616, download it and save in your PRTG install directory by default that’s C:\Program Files (x86)\PRTG Network Monitor\Custom Sensors. PRTG uses 32-bit Powershell, and if you have 64-bit Windows (and you have if you are using newer Windows than Server 2008), you should add 32-bit Powershell to your $PATH (append %systemroot%\SysWOW64\WindowsPowerShell\v1.0\ to PATH ENV variable). Also, you should set Powershell ExecutionPolicy to Unrestricted. I know this is not the best security practice – sign your scripts!
To set ExecutionPolicy run this from cmd.exe
%systemroot%\SysWOW64\WindowsPowerShell\v1.0\powershell.exe Set-ExecutionPolicy Unrestricted
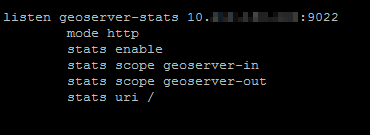
The next thing you should do is creating web stats in HAProxy configuration. I have stats listening on different ports for every site, and I make them read-only and without authentification, like this:
listen geoserver-stats 10.0.0.1:9022

        mode http

        stats enable

        stats scope geoserver-in

        stats scope geoserver-out

        stats uri /

Now your CSV stats will have this http://10.0.0.1:9022/;csv URL.
You can check if script is working by running this command from directory where .ps1 script is located. Of course, replace -url param with your URL.
.\HAProxy.ps1 -url "http://10.0.0.1:9015/;csv"

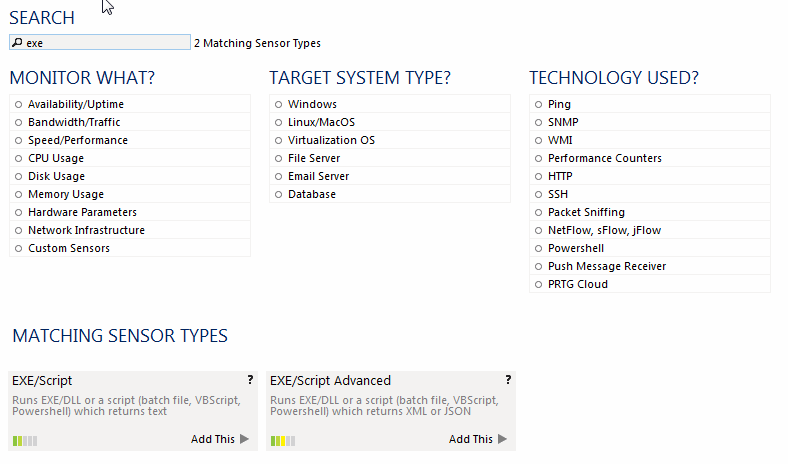
Open PRTG GUI and add new sensor with type EXE/script Advanced.

Under EXE/Script setting select downloaded .ps1 script and under Parameters enter -url “http://10.0.0.1:9022/;csv”.

Script uses two params url and monitor. URL param is self explanatory, and is mandatory. Monitor param is optional. Default value is standard, other templated values are responses and errors.
$templates =@{

	standard = "qcur,smax,scur,smax,slim,stot,bin,bout";

	responses = "hrsp_1xx,hrsp_2xx,hrsp_3xx,hrsp_4xx,hrsp_5xx,hrsp_other,req_rate,req_rate_max,req_tot";

	errors = "dreq,dresp,ereq,econ,eresp,chkfail";

}
If you want to monitor for errors you should use -url “http://10.0.0.1:9022/;csv” -monitor “errors” as Parameters option in PRTG Custom sensor. If none of the templates suit your needs, you can either edit them, or pass comma separated list of params found in https://gist.github.com/jlazic/50af0c706196bf81b616 or , like:
-url "http://10.0.0.1:9022/;csv" -monitor "stot,bin,eresp,hrsp_5xx,req_rate"
Save, repeat and watch nice graphs. Next step would be to setup alerting based on queue length, server backend availability, and UP->DOWN events in HAProxy. I will try and do that in next few days.

One thing to note is that PRTG does not support more than 50 channels per sensor.
Andrew Parker
Great post Josip, thanks!
When you say: “I have stats listening on different ports for every site, and I make them read-only and without authentification, like this:” how to you achieve this?
Where do you put this in the .cfg file in order to differentiate per site? For instance we have 4 front ends…
Thanks, again.
Josip Lazić
You can create read-only stats listener with something like this:
listen stats-site 10.10.10.1:9015

        mode http

        stats enable

        stats scope site-in

        stats scope site-out

        stats uri /
With stats scope you define which frontend and backends you want to cover with this stats scope. Now I have on http://10.10.10.1:9015/ statistics for my site-in frontend and site-out backend. If you have 4 frontend/backend combinations, you can create 4 stats listen sections with each listening on different port.
Josiah
Can this script be used when the stats are locked behind a username and password?
Josip Lazić
Authentification could be added, but PS script would need to be modified. Why not just whitelist one IP from which you will do monitoring. Add this to your monitoring listene section to limit access to stats to only one IP address:
acl allow_ip src 1.1.1.1/32

http-request deny if !allow_ip
Dan
Quick and dirt but, at the top add 2 declarations to param:
param(

	[string]$url,

	[string]$username,

	[string]$password,

	[string]$monitor

	);
Then replace:
$content = (new-object net.webclient).DownloadString($url)
With:
$webclient = New-Object System.Net.WebClient

$credCache = New-Object System.Net.CredentialCache

$credentials = new-object System.Net.NetworkCredential($username, $password)

$credCache.Add($url, "Basic", $credentials)

$webclient.Credentials = $credCache

$content = $webclient.DownloadString($url)
bob
What am I missing that PRTG always reports Response not wellformed:
It runs fine and displays results form the cli just like you show above.
Corné
Hi Bob,
Did you add the ‘EXE/Script Advanced’ sensor? You need to place the .ps1 in the folder ‘Custom Sensors\EXEXML’
If you add the EXE/Script sensor it will give a “Response not wellformed” error.
Regards,
Corné
Stephan Ryer
If you have multiple frontends or backends in your haproxy configs, this line will produce duplicate channel elements:
Write-Host “” $_.svname $names.($m)””
And this will end up making prtg ignore all values except the first for each name. Example:
BACKEND Current sessions <== Duplicate – exists multiple times in the output
0
Count
You actually need to include the sections names to the channel, like this:
Write-Host “”$_.pxname $_.svname $names.($m)””
And example of the output will then be:
MySectionName BACKEND Current sessions
0
Count
It took me quite some time to figure out this bug.
Stephan Ryer
If you have multiple frontends or backends in your haproxy configs, this line will produce duplicate channel elements:
Write-Host “<channel>” $_.svname $names.($m)”</channel>”
And this will end up making prtg ignore all values except the first for each name. Example:
<channel> BACKEND Current sessions </channel> <== Duplicate – exists multiple times in the output
<value> 0</value>
<unit> Count</unit>
</result>
You actually need to include the sections names to the channel, like this:
Write-Host “<channel>”$_.pxname $_.svname $names.($m)”</channel>”
And example of the output will then be:
<channel>MySectionName BACKEND Current sessions </channel>
<value> 0</value>
<unit> Count</unit>
</result>
It took me quite some time to figure out this bug.
Bart Reynaerts
Good explanation and it works with PRTG if the beta sensors feature is enabled (for example, to use Fortinet sensors), you replace Write-Host with Write-Output.
https://www.paessler.com/manuals/prtg/custom_sensors#exe_script
Lumpi
I don´t know if anyone still reads here, but I try…
The script runs well and gives a lot of information, but I have the very simple request to only monitor the status of the containers (up/down). If I run the script standalone, it does just fine and reports UP or DOWN. If I run the script from PRTG, it always reports 0 regardless of the container status. I do -monitor (status) or -monitor (check_status), all the same…
Can anyone kick me in the right direction, please? Any help is appreacheated, thanks
Lumpi